HubSpot reporting best practices are essential for making smart, data-driven decisions without wasting time. From tracking marketing performance to analysing sales pipelines, the right approach to reporting provides the clarity needed for growth.
HubSpot’s built-in tools are powerful, but only if you understand how to use them effectively.
In this blog post, you will learn how to take control of your reporting and transform your data into tangible business results. We will also explain HubSpot reporting best practices and highlight common mistakes to avoid for your business.
How Do You Set Up Dashboards in HubSpot?
Creating dashboards in HubSpot begins with understanding what your team needs to monitor. The platform enables you to consolidate related reports in one location, facilitating easier performance tracking and data-driven decision-making.
An effectively designed dashboard ensures you can swiftly access the most significant metrics.
How to Create and Customize Dashboards
To get started, head to Reporting > Dashboards and click “Create dashboard”. You’ll have the option to use pre-made templates or build one from scratch.

Templates can save time, but customized dashboards often align better with your specific business goals.
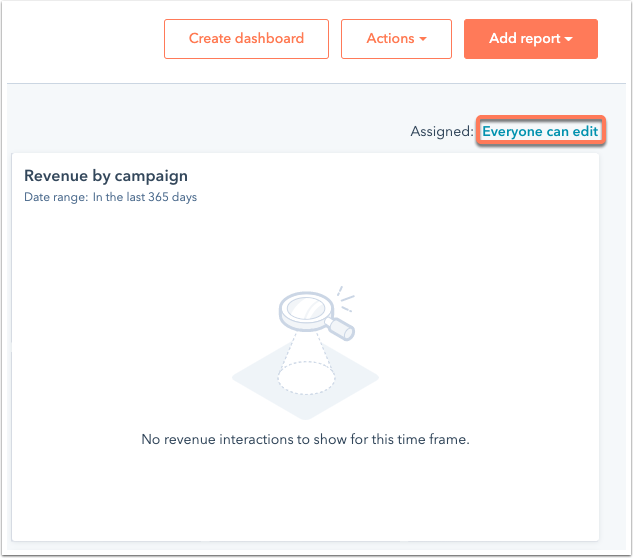
Once your dashboard is set up, it’s time to make it your own. Click “Add report” to include existing reports or create new ones directly in the dashboard.
HubSpot allows flexible filtering options, so you can adjust reports to show data by date ranges, team members, pipelines, or other criteria. This ensures each dashboard delivers the insights your audience needs.
You can customize a report by hovering over a report, clicking the “View and filter icon”, and selecting “Customize” to tweak its appearance or data settings.
You can rearrange reports by dragging and dropping them or resizing them by pulling on the bottom right corner. This drag-and-drop feature helps you create layouts that highlight your most critical metrics.
Need to add some context? You can include notes with text, images, or even videos to explain key metrics.
Another important feature is access control. You can set dashboards to be private, public, or restricted to specific users. Super admins and users with Reports and dashboards permissions can manage all dashboards, while others will only see what they’re authorized to access.
How to Organize Dashboards for Better Efficiency
A well-organized dashboard setup can save your team time and effort. The best approach is to create dashboards tailored to specific functions, allowing each team to focus on what’s relevant to them.
- Marketing dashboards: Focuses on metrics such as website traffic, lead generation, conversion rates, and email performance.
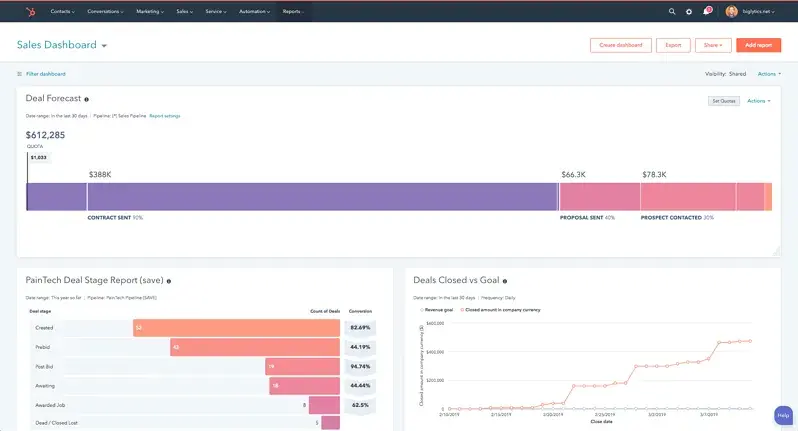
- Sales dashboards: Highlights deals closed, deals in progress, average deal size, pipeline value, sales qualified leads (SQLs), and revenue.
- Customer success dashboards: Track metrics such as Net Promoter Score (NPS), renewal rates, upsell opportunities, and support ticket volumes.
“The best sales dashboards fit users’ specific needs. A sales manager tracks team performance, while an analyst delves into sales metrics for insights.” – Ali Flynn, Cofounder, Improvado
For leadership teams, cross-functional dashboards provide a big-picture view by combining key metrics from multiple departments. These dashboards help connect the dots between shared goals and overall business performance.
Additionally, keep in mind that HubSpot dashboards have some limitations. For instance, they can’t load reports with more than 100 values in the “Break down by” property. Therefore, to avoid issues, you should structure your reports carefully and consider breaking large datasets into multiple focused reports.
What Are the Key Metrics to Track for Marketing Performance?
According to HubSpot, 75% of users report increased revenue, 80% see improved productivity, and 76% notice a return on investment. The platform’s reporting tools provide clear results when you focus on the right metrics.
Core Metrics for Marketing and Sales
For a better picture of your performance, include these core metrics in your dashboard. Revenue metrics provide the foundation, as total revenue gives you the big picture, while segmentation highlights growth trends.
Michele Potts, Director of Sales at Zoe Marketing and Communications, explains:
“Tracking sales revenue helps you understand the direct outcome of your sales efforts. It allows you to gauge the effectiveness of your strategies and make informed decisions to drive growth.”
Conversion rates and win rates are equally important for evaluating funnel efficiency. Jose Rodríguez Maldonado, CEO of Databay Solutions, notes:
“A deep focus on this metric allows us to identify not only the quality of the leads generated by our marketing efforts but also the efficiency of our sales processes. By analyzing our conversion rate, we can adjust our persuasion techniques, improve the training of our sales team, and refine our marketing messages to better resonate with our target audience.”
Lead response time is critical, as 50% of B2B sales favor the company that responds the fastest. Track your average response time and the percentage of leads followed up on to ensure no opportunities are missed.
Email performance metrics are another area to focus on. According to HubSpot, open rates typically range from 25% to 41%, and segmented campaigns perform even better, with 30% higher open rates and 50% higher click-through rates compared to unsegmented ones.
Therefore, you should monitor open rates, click rates, and response rates to fine-tune your email campaigns.
Customer Lifecycle and Engagement Metrics
Understanding your contacts’ positions in the customer lifecycle enables you to deliver the right message at the right time. HubSpot’s lifecycle stages from subscriber to evangelist offer a framework to track progression and pinpoint conversion opportunities.
Customer lifetime value (CLV) is a powerful metric for identifying the most profitable segments.
Zeeshan Khan, CEO of Dark Square, highlights its importance:
“By tracking CLTV, we’ve been able to identify high-value customer segments and tailor our services accordingly. This has led to increased customer satisfaction, repeat business, and ultimately, higher revenue.”
Net Promoter Score (NPS) is another key measure, reflecting customer satisfaction and loyalty potential. According to a study by Accenture, 57% of consumers are willing to spend more on brands they trust.
You should pair NPS with retention rates to gauge how well you’re maintaining relationships with existing customers.
New lead generation is essential for keeping your pipeline active. David Martirosian, Founder of David Martirosian, warns:
“It’s very easy to start chasing old leads, pursuing lost deals, and even following up too much with clients. It’s the path of least resistance, and it causes your pipeline to stagnate and fall apart…To me, tracking new leads will keep your business healthy and moving forward.”
Assessing lead quality ensures you’re attracting the right prospects. As Faton Sopa, Co-Founder & CEO of Superlinks, puts it:
“None of these matters if the person who shows up in front of you on your call is unqualified. That is a loss of time, resources, and investment.”
Additionally, you should monitor lifecycle progression to identify conversion bottlenecks. HubSpot’s campaign reports can help you analyze contacts at each stage and calculate the cost of advancing them through the lifecycle.
Campaign Attribution and ROI Tracking
Once you have a solid understanding of customer metrics, connect them to campaign performance and ROI. This step refines your strategy and helps you focus on what drives results.
- Return on investment (ROI) is a vital metric for linking marketing activities to revenue. By setting up closed-loop reporting in HubSpot, you can track leads from their first interaction to the final sale, showing which campaigns generate actual revenue – not just leads.
- Customer acquisition cost (CAC) is another important figure. Calculate CAC by dividing your total marketing and sales expenses by the number of new customers acquired within a specific period. Compare this to CLV to ensure your growth is profitable.
- Attribution modeling helps you understand how different touchpoints contribute to conversions. HubSpot’s reports provide insights into first-touch, last-touch, and multi-touch contributions. By analyzing both direct and indirect attribution, you can see which efforts drive purchases and which influence prospects over time.
- Channel performance metrics guide budget allocation. Monitor website traffic sources, conversion rates, and revenue attribution to pinpoint your most effective channels. Metrics like bounce rates and time on site also shed light on engagement quality.
For more granular insights, track campaign-specific metrics such as cost per lead, lead-to-customer conversion rates, and revenue per campaign. HubSpot’s campaign tools let you tag related activities and measure their overall performance.
Sales cycles often span multiple quarters, so align your reports with your fiscal calendar and adjust for seasonal trends to ensure accurate year-over-year comparisons.
The secret to successful HubSpot reporting lies in choosing metrics that align with your business goals and tracking them consistently.
Therefore, you should concentrate on actionable insights instead of vanity metrics and utilise HubSpot’s automation tools to streamline data collection and analysis. This approach will provide you with a clearer understanding of what is effective and where improvements can be made.
How Can You Use AI and Automation in HubSpot Reports?
According to the PWC report, the AI market is anticipated to reach $15.7 trillion by 2030, and utilising AI and automation tools for reporting will be essential for a successful strategy.
HubSpot builds on its core capabilities with features that help businesses work smarter, automate repetitive tasks, and make better decisions through data.
AI-Driven Insights and Forecasting
HubSpot’s AI tools do more than just collect data; they actively interpret it. For instance, consider predictive sales forecasting.
By utilizing machine learning, AI tools analyze past data to forecast future revenue with greater accuracy than traditional methods. This enables sales teams to set realistic goals and allocate resources effectively.
Another feature is automated lead scoring. HubSpot evaluates prospects based on their activity, engagement, and profile details to identify high-potential leads.
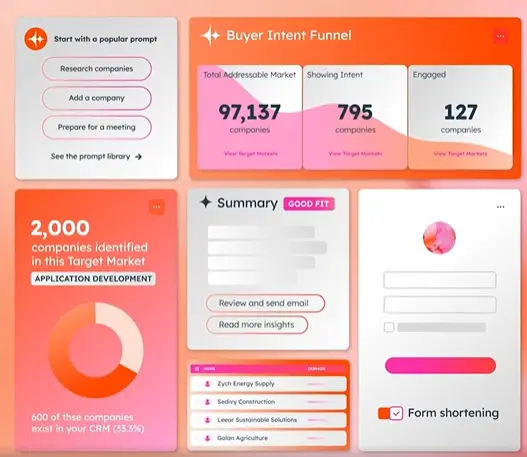
Add-ons like Breeze Intelligence enhance this capability by identifying companies with strong intent based on their behavior across various websites.
These insights are not isolated and can be utilized to create custom dashboards and reports that track your key metrics in real-time. This allows for quicker adjustments to strategies, improved forecasting, and more efficient resource management, all driven by data from multiple channels.
Automating Reporting Processes
HubSpot’s automation tools simplify tasks while enhancing accuracy. For example, you can schedule recurring email reports on a daily, weekly, or monthly basis to deliver essential metrics directly to stakeholders.
These reports can also be shared automatically via email, Slack, or Google Chat, ensuring everyone stays informed.
Workflow automation is another significant advancement in HubSpot reporting. It connects various touchpoints and updates reports with fresh data automatically. Even minor features, like AI-generated workflow names, help reduce friction and streamline processes.
Experts have utilized tools like ChatGPT to assess campaign performance across different platforms, revealing actionable insights. Custom dashboards can be created to monitor campaign results, such as how leads interact with email or workflow campaigns.
Additionally, automated tasks can verify dashboard data before reports are sent, ensuring that the information is accurate and relevant.
How Do You Build Custom Reports and Perform Advanced Analysis in HubSpot?
Continuing from our earlier discussion on dashboard customisation and metric tracking, custom reports elevate your insights to the next level.
With HubSpot’s custom report builder, raw data transforms into actionable insights that can inform your business decisions.
While standard reports offer quick overviews, custom reports allow you to explore specific performance areas in greater depth by integrating data from marketing, sales, and service activities. Aligning your report design with business goals enables you to uncover insights that extend beyond surface-level metrics.
Let’s explore how to create meaningful custom reports and apply advanced analytical techniques to maximize their value.
Creating Custom Reports for Business Goals
To build effective custom reports, start by defining clear objectives and key performance indicators (KPIs) before getting into HubSpot’s report builder. This ensures your focus remains on data that drives results, rather than getting distracted by information that might look interesting but doesn’t align with your goals.
Different types of custom reports you can create through HubSpot are:
- Single object reports
- Funnel reports
- Custom report builder
- Contact attribution reports
- Deal creation attribution reports
- Revenue attribution reports
- One to one email reports
HubSpot’s custom report builder lets you analyze data from marketing, sales, and service. You can save reports to lists, add them to dashboards, or export them for more analysis.
Choosing the right data source is crucial. It helps you identify the main object you are reporting on and sets it as your foundation. This choice affects what data you can access and how it connects to other information in your HubSpot account.
Custom properties are another powerful tool for capturing unique data points essential for revenue tracking.
For instance, if you’re focusing on enterprise deals, you could create custom properties to track decision-maker roles, budget approval stages, or implementation timelines.
These properties can then be used as fields in your reports, adding a layer of detail beyond standard metrics.
Integrating HubSpot with tools such as accounting and sales software completes the overall picture. This integration ensures that your revenue reports accurately reflect the entire customer journey, from initial contact to closed deals, and even customer lifetime value.
Additionally, specialized report types such as deal forecasts, recurring revenue, and sales pipeline reports can be customized with calculated fields and data segmentation to fit your specific business model.
For instance, a SaaS company might prioritize metrics such as monthly recurring revenue and churn rates, while an e-commerce business may focus on average order value and repeat purchases.
Additionally, consistent naming conventions for campaigns and assets are essential for making your reports clear and reliable. When your data is well-organized, reports become easier to interpret across teams and periods.
Advanced Analysis Techniques
Once your custom reports are set up, you can use advanced analytical methods to deepen your insights and refine decision-making.
HubSpot’s campaign attribution tools help you connect marketing efforts to measurable outcomes. These tools allow you to evaluate individual campaign performance by analyzing asset data, applying attribution models like first-touch or last-touch, and using date filters to focus on specific timeframes.
Using multiple attribution models provides a more comprehensive view of campaign effectiveness.
First-touch attribution highlights which campaigns initially brought prospects into your funnel, while last-touch attribution shows what ultimately converted them. Together, these models help you understand the full customer journey and allocate resources more effectively.
Metrics like time-to-conversion and engagement frequency offer valuable insights into bottlenecks in your sales process. Combining lead scoring with attribution data can help you zero in on high-quality leads that are most likely to convert.
Segmenting revenue attribution by campaign stage can reveal which parts of your marketing funnel have the greatest financial impact.
For instance, awareness campaigns might not directly drive revenue but could significantly influence conversion rates for prospects engaging with consideration-stage content.
Cohort analysis is another powerful tool, grouping customers based on shared characteristics or behaviors. Tracking these groups over time can uncover trends in retention, expansion revenue, or support needs.
This approach is especially insightful when segmenting by acquisition channel, company size, or region.
Customizing attribution reports allows you to tailor insights for different stakeholders. For example, executives might prefer high-level revenue attribution, while marketing teams may need detailed data on individual campaign performance.
Comparing Report Types and Configurations
Understanding the different types of reports available in HubSpot can help you choose the best fit for your analysis needs:
|
Report Type |
Best Use Case |
Advantages |
Limitations |
|
Standard Reports |
Quick performance snapshots |
Easy to set up; covers essential metrics |
Limited customization options |
|
Custom Reports |
In-depth analysis of specific areas |
Combines multiple data sources; highly customizable |
Requires more setup time |
|
Dashboard Reports |
Real-time monitoring |
Centralized view; promotes team collaboration |
Limited to 10 reports per dashboard |
|
Attribution Reports |
Campaign ROI analysis |
Connects marketing actions to revenue |
Requires accurate campaign tagging |
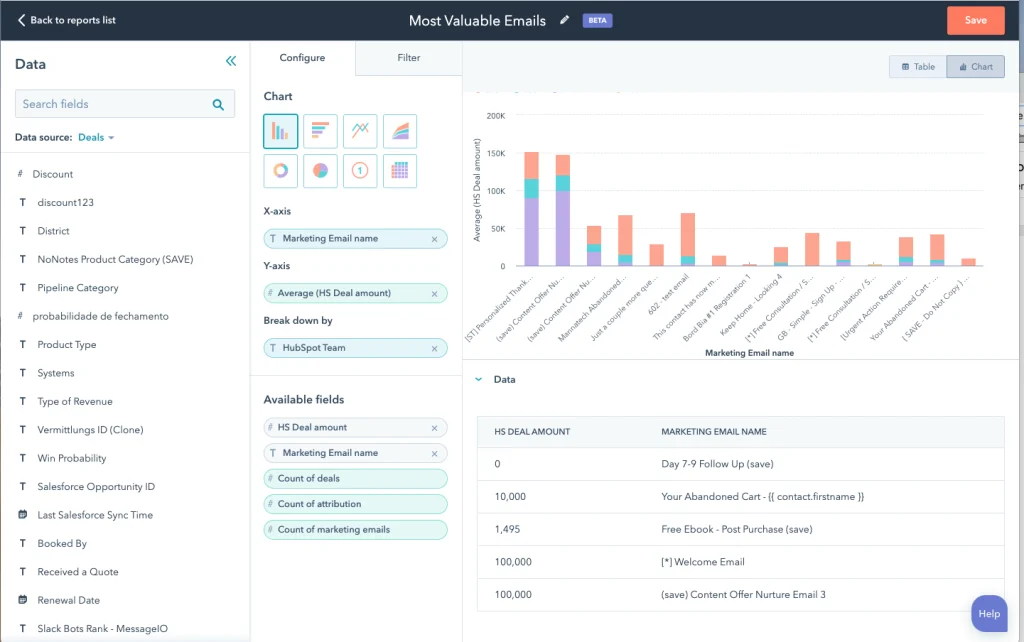
Different chart types within reports serve distinct purposes. For example, bar and column charts are great for comparing campaign performance, while line and area charts show trends over time.
Similarly, pie and doughnut charts work well for visualizing proportions, such as traffic sources or deal stages.
For more complex insights, pivot tables and scatter plots can reveal relationships between variables that aren’t immediately obvious.
When analyzing metrics, it’s important to differentiate between measurement metrics and optimization metrics.
Measurement metrics such as “deals closed” or “revenue generated” are ideal for executive dashboards. Optimization metrics such as “session-to-contact rates” or “email open rates” help guide strategic decisions and improve campaigns.
While the number of custom reports you can create depends on your HubSpot subscription, prioritize those that support your most critical business decisions.
Keep dashboards simple by limiting them to no more than 10 reports to avoid overwhelming users. Filters can help focus on specific data subsets, making your reports clearer and more actionable.
Finally, track personalization metrics and customer experience indicators alongside traditional performance measures. This approach aligns with the expectations of 66% of consumers who want companies to understand their needs.
By doing so, your reports will not only drive business results but also help you meet the evolving expectations of your customers.
HubSpot Reporting Best Practices You Can’t Ignore
To get the best results from HubSpot reporting, focus on using the right features effectively. Here are 7 proven HubSpot reporting best practices:
1. Build Reports That Solve a Business Problem
You should not create reports for the sake of reporting. Each one should answer a specific question, including:
- Are leads converting?
- Does our ad spend work?
- Where are deals getting stuck?
If a report doesn’t help you take action, it’s a waste of screen space.
2. Tailor Dashboards for Different Roles
Different teams have different priorities. Executives want revenue forecasts, sales managers need pipeline breakdowns, and marketers look for conversion data. Therefore, create dashboards that meet each team’s needs, so no one must sort through a confusing, one-size-fits-all setup.
3. Standardise Naming and Data Entry Across the CRM
If your team labels things differently or skips fields, your reports will be unreliable. Therefore, you should set clear rules for lifecycle stages, lead statuses, and custom properties and enforce them in reports.
4. Use Filters to Get Specific, Not Just Broad
Using generic data alone isn’t sufficient for effective decision-making. It’s essential to apply filters to your reports based on criteria such as source, region, sales representative, or campaign. This approach provides the necessary context to identify trends and promptly address any issues that may arise.
5. Visualise Trends Over Time, Not Just Snapshots
A single number alone doesn’t provide much insight. It’s important to track performance over weeks or months to determine what’s effective and what’s lagging. Additionally, utilize line charts, bar graphs, or comparison views to identify momentum or its absence.
6. Use Custom Properties Strategically
Default fields have limitations. Create custom properties that fit your internal process, like “Demo Booked Date” or “Lead Source Detail.” This will help you gain clearer insights into what influences movement.
7. Schedule Regular Report Reviews
Creating the report is not enough. Therefore, schedule a weekly or monthly meeting to review results with your team. Ask yourself:
- What has changed?
- What actions should we take?
The purpose of reporting is to drive decisions, not just provide information.
HubSpot Reporting Mistakes You Should Avoid
If you’re serious about getting results, you can’t afford to get reporting wrong. These common mistakes are costing teams clarity, accuracy, and growth. Here are the common HubSpot reporting mistakes you should avoid:
1. Tracking Everything Instead of What Matters
Too many metrics can make your dashboard confusing. Therefore, you need to focus on the important ones. Track key performance indicators (KPIs) that help you make decisions, like cost per lead, conversion rates, or revenue impact.
2. Using Default Reports
Default reports tend to be generic and may not provide the insights you need. To gain meaningful information, it’s essential to customize filters, time frames, and data properties according to your specific goals and workflows. By tailoring reports to your unique requirements, you can transform potential noise into valuable insights.
3. Skipping Attribution Models
Utilizing attribution reports is essential for accurately understanding which marketing channels are effective for your business. By implementing a suitable model such as first-touch, multi-touch, or a custom approach, you can make informed decisions about where to allocate your investment and maximize your results. This strategic analysis helps eliminate guesswork and ensures you focus your resources on the channels that truly drive success.
4. Relying on Inaccurate Data
Maintaining clean and accurate data is crucial for making informed decisions. Issues such as incomplete tracking, outdated lifecycle stages, and misapplied fields can compromise the integrity of your reports. Therefore, it’s important to regularly clean your CRM and uphold data consistency to ensure accuracy and reliability.
5. Using One Dashboard for Everyone
Generic dashboards serve no one. Sales needs pipeline velocity, marketing needs lead quality, and leadership needs revenue visibility. Therefore, data analysts should build dashboards tailored to each team’s priorities.
How Can Automation Strategists Help
Automation Strategy Group specializes in maximizing HubSpot’s AI and automation capabilities for businesses. As certified HubSpot partners, we provide tailored strategies which include predictive analytics and automated workflows.
Our focus on lifecycle marketing ensures accurate reporting at every customer journey stage, utilizing Smart Properties for lead qualification and Breeze Intelligence for account prioritization.
Also, we audit existing reporting systems to identify automation opportunities and optimizing data flow for accurate insights.
For businesses ready to enhance reporting automation, we offer ongoing support as HubSpot introduces new AI features. With experience across platforms like HubSpot, we create integrated reporting systems that provide a comprehensive view across marketing channels. We help businesses leverage AI-powered reporting for a true competitive advantage.
For more information, schedule a free consultation with our HubSpot specialist.
Final Thoughts
To effectively use HubSpot reporting, it’s essential to start with strategic planning and set clear goals. Begin by identifying the specific questions you want to address, and then determine the necessary data before constructing your report.
By following the detailed strategies outlined in this blog post, you can maximize your use of reporting tools, from creating basic dashboards to conducting in-depth custom analyses.
Lastly, by applying HubSpot reporting best practices, you can transform your reporting process into a valuable resource for making informed business decisions.
Optimize Your Marketing Automation
Partner with certified experts to enhance your sales funnel, improve lead engagement, and maximize ROI with tailored strategies for HubSpot, ActiveCampaign, and Eloqua.
HubSpot Reporting Related FAQs
What are the key HubSpot reporting best practices for marketers?
Marketers should focus on campaign-level performance, lead quality, and ROI. Best practices include using attribution reports, filtering by source, setting up custom properties for tracking campaign types, and reviewing trends over time.
How can I improve the accuracy of my HubSpot reports?
Start by standardising data input across your team. Use consistent lifecycle stages, validate form fields, and clean outdated properties. Always test your filters and cross-check with actual CRM records to spot errors early.
What types of dashboards should I build in HubSpot?
Create role-specific dashboards such as sales dashboards for pipeline velocity and deal stages, marketing dashboards for lead conversion and attribution, and executive dashboards for revenue, MRR, or customer retention metrics.
Why is filtering important in HubSpot reporting?
Filters help you zero in on what matters by campaign, source, region, or lifecycle stage. Without them, your reports can be too broad to be useful. Precise filters lead to faster insights and better decisions.
How often should I review HubSpot dashboards?
Weekly for sales and marketing teams; monthly for leadership reviews. Frequent reviews ensure you’re acting on current trends, spotting slowdowns early, and making decisions based on real-time performance.